 Catalogue PIGMA
Federal Maritime and Hydrographic Agency
Type of resources
Available actions
Topics
Keywords
Contact for the resource
Provided by
Years
Formats
Representation types
Scale
Resolution
-
EMODnet Chemistry aims to provide access to marine chemistry data sets and derived data products concerning eutrophication, ocean acidification and contaminants. The chemicals chosen reflect importance to the Marine Strategy Framework Directive (MSFD). This regional aggregated dataset contains all unrestricted EMODnet Chemistry data on contaminants (20 parameters), and covers the North East Atlantic Ocean with 2400 CDI records divided per matrices: 122 in biota (as time series), 1689 in water (as vertical profiles), 589 in sediment (478 Vertical profiles and 111 Time series). Vertical profiles temporal range is from 1970-07-29 to 2017-02-28. Time series temporal range is from 1979-02-28 to 2014-10-21. Data were aggregated and quality controlled by ‘IFREMER / IDM / SISMER - Scientific Information Systems for the SEA’ from France. Regional datasets concerning contaminants are automatically harvested. Parameter names in these datasets are based on P01, BODC Parameter Usage Vocabulary, which is available at: http://seadatanet.maris2.nl/bandit/browse_step.php . Each measurement value has a quality flag indicator. The resulting data collections for each Sea Basin are harmonised, and the collections are quality controlled by EMODnet Chemistry Regional Leaders using ODV Software and following a common methodology for all Sea Regions. Harmonisation means that: (1) unit conversion is carried out to express contaminant concentrations with a limited set of measurement units (according to EU directives 2013/39/UE; Comm. Dec. EU 2017/848) and (2) merging of variables described by different “local names” ,but corresponding exactly to the same concepts in BODC P01 vocabulary. The harmonised dataset can be downloaded as ODV spreadsheet (TXT file), which is composed of metadata header followed by tab separated values. This worksheet can be imported to ODV Software for visualisation (More information can be found at: https://www.seadatanet.org/Software/ODV ). The same dataset is offered also as XLSX file in a long/vertical format, in which each P01 measurement is a record line. Additionally, there are a series of columns that split P01 terms in subcomponents (measure, substance, CAS number, matrix...).This transposed format is more adapted to worksheet applications users (e.g. LibreOffice Calc). The 20 parameter names in this metadata record are based on P02, SeaDataNet Parameter Discovery Vocabulary, which is available at: http://seadatanet.maris2.nl/v_bodc_vocab_v2/vocab_relations.asp?lib=P02 . Detailed documentation will be published soon. The original datasets can be searched and downloaded from EMODnet Chemistry Download Service: https://emodnet-chemistry.maris.nl/search
-
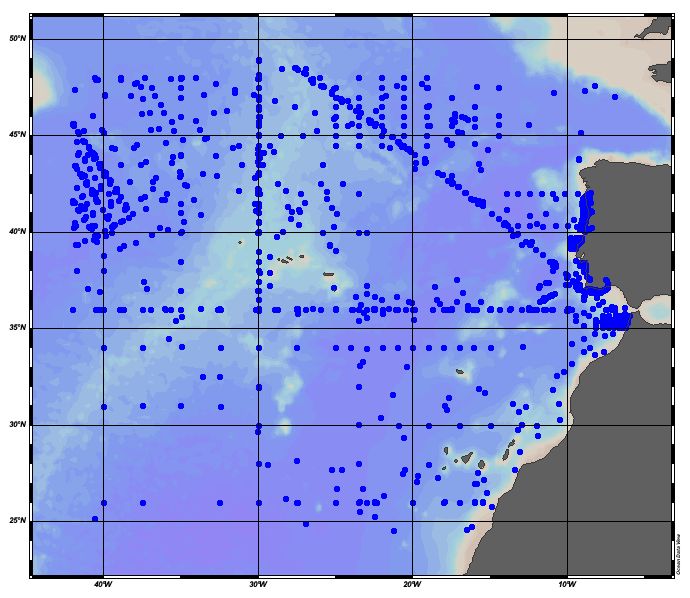
EMODnet Chemistry aims to provide access to marine chemistry datasets and derived data products concerning eutrophication, acidity and contaminants. The importance of the selected substances and other parameters relates to the Marine Strategy Framework Directive (MSFD). This aggregated dataset contains all unrestricted EMODnet Chemistry data on potential hazardous substances, despite the fact that some data might not be related to pollution (e.g. collected by deep corer). Temperature, salinity and additional parameters are included when available. It covers the Northeast Atlantic Ocean (40W). Data were harmonised and validated by the '‘IFREMER / IDM / SISMER - Scientific Information Systems for the SEA’ in France. The dataset contains water (profiles), sediment (profiles and timeseries) and biota (timeseries). The temporal coverage is 1974–2018 for water measurements, 1966–2014 for sediment measurements and 1979–2021 for biota measurements. Regional datasets concerning contaminants are automatically harvested and the resulting collections are harmonised and validated using ODV Software and following a common methodology for all sea regions ( https://doi.org/10.6092/8b52e8d7-dc92-4305-9337-7634a5cae3f4). Parameter names are based on P01 vocabulary, which relates to BODC Parameter Usage Vocabulary and is available at: https://vocab.nerc.ac.uk/search_nvs/P01/. The harmonised dataset can be downloaded as as an ODV spreadsheet, which is composed of a metadata header followed by tab separated values. This spreadsheet can be imported into ODV Software for visualisation (more information can be found at: https://www.seadatanet.org/Software/ODV). In addition, the same dataset is offered also as a txt file in a long/vertical format, in which each P01 measurement is a record line. Additionally, there are a series of columns that split P01 terms into subcomponents (substance, CAS number, matrix...).This transposed format is more adapted to worksheet applications (e.g. LibreOffice Calc).
-
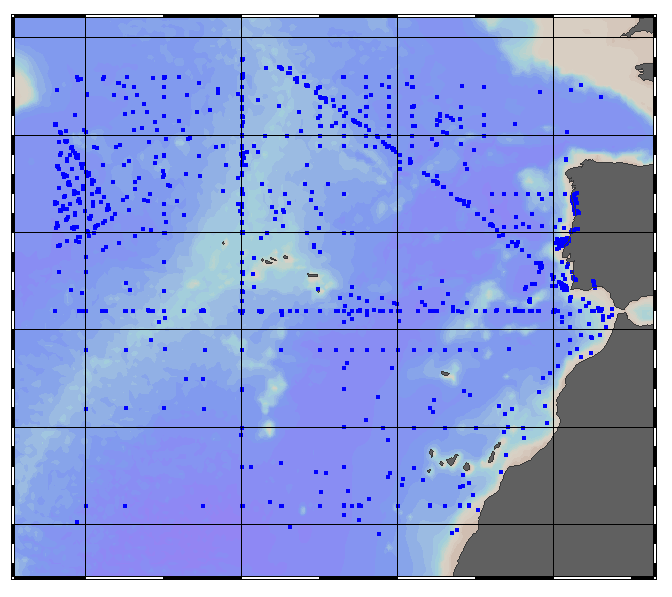
EMODnet Chemistry aims to provide access to marine chemistry data sets and derived data products concerning eutrophication, ocean acidification and contaminants. The chemicals chosen reflect importance to the Marine Strategy Framework Directive (MSFD). This regional aggregated dataset contains all unrestricted EMODnet Chemistry data on contaminants; temperature, salinity and additional sampling parameters are included when available. The spatial coverage is the North East Atlantic Ocean with 2438 CDI records divided per matrices: 126 in biota (as time series), 1704 in water (as vertical profiles) and 608 in sediment (497 Vertical profiles and 111 Time series). For water data, vertical profiles temporal range is from 1974-11-22 to 2013-08-15. For sediment data, vertical profiles temporal range is from 1966-01-01 to 2007-06-30 and time series temporal range is from 1999-06-05 to 2014-10-21. For biota data, time series temporal range is from 1979-02-28 to 2019-03-07. Data were aggregated and quality controlled by ‘IFREMER / IDM / SISMER - Scientific Information Systems for the SEA’ from France. Regional datasets concerning contaminants are automatically harvested. Parameter names in these datasets are based on P01, BODC Parameter Usage Vocabulary, which is available at: https://vocab.seadatanet.org/p01-facet-search. Each measurement value has a quality flag indicator. The resulting data collections for each Sea Basin are harmonised, and the collections are quality controlled by EMODnet Chemistry Regional Leaders using ODV Software and following a common methodology for all Sea Regions. Harmonisation means that: (1) unit conversion is carried out to express contaminant concentrations with a limited set of measurement units (according to EU directives 2013/39/UE; Comm. Dec. EU 2017/848) and (2) merging of variables described by different “local names” ,but corresponding exactly to the same concepts in BODC P01 vocabulary. Detailed documentation is available at: https://doi.org/10.6092/8b52e8d7-dc92-4305-9337-7634a5cae3f4 Explore and extract data at: https://emodnet-chemistry.webodv.awi.de/contaminants%3EAtlantic The harmonised dataset can also be downloaded as ODV spreadsheet (TXT file), which is composed of metadata header followed by tab separated values. This worksheet can be imported to ODV Software for visualisation (More information can be found at: https://www.seadatanet.org/Software/ODV ). The same dataset is offered also as TXT file in a long/vertical format, in which each P01 measurement is a record line. Additionally, there are a series of columns that split P01 terms in subcomponents (measure, substance, CAS number, matrix...).This transposed format is more adapted to worksheet applications users (e.g. LibreOffice Calc). The original datasets can be searched and downloaded from EMODnet Chemistry Chemistry CDI Data and Discovery Access Service: https://emodnet-chemistry.maris.nl/search
-

EMODnet Chemistry aims to provide access to marine chemistry datasets and derived data products concerning eutrophication, acidity and contaminants. The importance of the selected substances and other parameters relates to the Marine Strategy Framework Directive (MSFD). This aggregated dataset contains all unrestricted EMODnet Chemistry data on potential hazardous substances, despite the fact that some data might not be related to pollution (e.g. collected by deep corer). Temperature, salinity and additional parameters are included when available. It covers the Northeast Atlantic Ocean (40W). Data were harmonised and validated by the '‘IFREMER / IDM / SISMER - Scientific Information Systems for the SEA’ in France. The dataset contains water (profiles), sediment (profiles and timeseries) and biota (timeseries). The temporal coverage is 1974–2018 for water measurements, 1966–2020 for sediment measurements and 1979–2022 for biota measurements. Regional datasets concerning contaminants are automatically harvested and the resulting collections are harmonised and validated using ODV Software and following a common methodology for all sea regions ( https://doi.org/10.6092/8b52e8d7-dc92-4305-9337-7634a5cae3f4). Parameter names are based on P01 vocabulary, which relates to BODC Parameter Usage Vocabulary and is available at: https://vocab.nerc.ac.uk/search_nvs/P01/. The harmonised dataset can be downloaded as as an ODV spreadsheet, which is composed of a metadata header followed by tab separated values. This spreadsheet can be imported into ODV Software for visualisation (more information can be found at: https://www.seadatanet.org/Software/ODV). In addition, the same dataset is offered also as a txt file in a long/vertical format, in which each P01 measurement is a record line. Additionally, there are a series of columns that split P01 terms into subcomponents (substance, CAS number, matrix...).This transposed format is more adapted to worksheet applications (e.g. LibreOffice Calc).
-
Moving 10-years analysis of Phosphate at Northeast Atlantic Ocean for each season: - winter: January-March, - spring: April-June, - summer: July-September, - autumn: October-December Every year of the time dimension corresponds to the 10-year centred average of each season. Decades span : - from 1963-1972 until 2005-2014 (winter) - from 1963-1972 until 2005-2014 (spring) - from 1964-1973 until 2005-2014 (summer) - from 1964-1973 until 2005-2014 (autumn) Observational data span from 1962 to 2014. Depth range (IODE standard depths): -3000.0, -2500.0, -2000.0, -1750, -1500.0, -1400.0, -1300.0, -1200.0, -1100.0, -1000.0, -900.0, -800.0, -700.0, -600.0, -500.0, -400.0, -300.0, -250.0, -200.0, -150.0, -125.0, -100.0, -75.0, -50.0,-40.0, -30.0, -20.0, -10.0, -5.0, -0.0 Data Sources: observational data from SeaDataNet/EMODNet Chemistry Data Network. Description of DIVA analysis: Geostatistical data analysis by DIVA (Data-Interpolating Variational Analysis) tool. GEBCO 1min topography is used for the contouring preparation. Analyzed filed masked using relative error threshold 0.3 and 0.5 DIVA settings. Signal to noise ratio and correlation length were optimized and filtered vertically and a seasonally-averaged profile was used. Logarithmic transformation applied to the data prior to the analysis. Background field: the data mean value is subtracted from the data. Detrending of data: no, Advection constraint applied: no. Units: umol/l
-
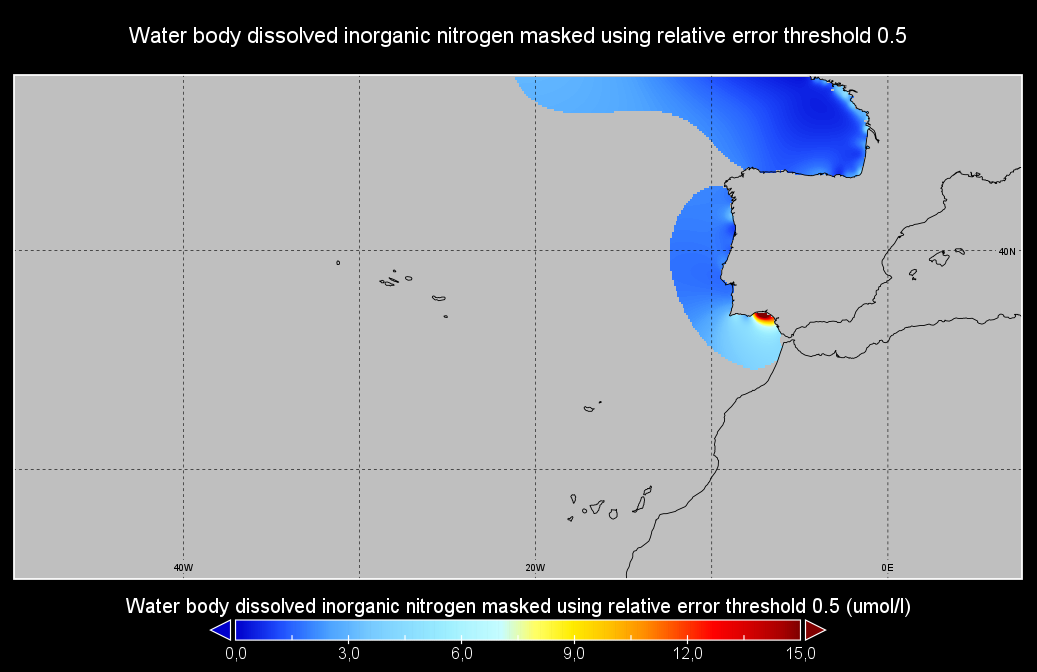
Moving 6-year analysis of Water body dissolved inorganic nitrogen in the NorthEast Atlantic for each season: - winter: January-March, - spring: April-June, - summer: July-September, - autumn: October-December. Every year of the time dimension corresponds to the 6-year centred average of each season. 6-year periods span from 1971/1976 until 2016/2021. Observation data span from 1971 to 2021. Depth levels (IODE standard depths): [0.0, 5.0, 10.0, 20.0, 30.0, 40.0, 50.0, 75.0, 100.0, 125.0, 150.0, 200.0, 250.0, 300.0, 400.0, 500.0, 600.0, 700.0, 800.0, 900.0, 1000.0, 1100.0, 1200.0, 1300.0, 1400.0, 1500.0, 1750.0, 2000.0]. Data sources: observational data from SeaDataNet/EMODNet Chemistry Data Network. Descrption of DIVAnd analysis: the computation was done with DIVAnd (Data-Interpolating Variational Analysis in n dimensions), version 2.7.4, using GEBCO 30 sec topography for the spatial connectivity of water masses. The horizontal resolution of the produced DIVAnd maps is 0.1 degrees. Horizontal correlation length varies from 400km in open sea regions to 50km at the coast. Vertical correlation length is defined as twice the vertical resolution. Signal-to-noise ratio was fixed to 1 for vertical profiles and 0.1 for time series to account for the redundancy in the time series observations. A logarithmic transformation (DIVAnd.Anam.loglin) was applied to the data prior to the analysis to avoid unrealistic negative values. Background field: a vertically-filtered profile of the seasonal data mean value (including all years) is substracted from the data. Detrending of data: no, advection constraint applied: no. Units: umol/l.
-
Moving 10-years analysis of nitrate plus nitrite at Northeast Atlantic Ocean for each season: - winter: January-March, - spring: April-June, - summer: July-September, - autumn: October-December. Every year of the time dimension corresponds to the 10-year centred average of each season. Decades span : - from 1984-1993 until 2005-2014 (winter) - from 1979-1988 until 2005-2014 (spring) - from 1982-1991 until 2005-2014 (summer) - from 1972-1981 until 2005-2014 (autumn) Observational data span from 1962 to 2014. Depth range (IODE standard depths): -3000.0, -2500.0, -2000.0, -1750, -1500.0, -1400.0, -1300.0, -1200.0, -1100.0, -1000.0, -900.0, -800.0, -700.0, -600.0, -500.0, -400.0, -300.0, -250.0, -200.0, -150.0, -125.0, -100.0, -75.0, -50.0,-40.0, -30.0, -20.0, -10.0, -5.0, -0.0 Data Sources: observational data from SeaDataNet/EMODNet Chemistry Data Network. Description of DIVA analysis: Geostatistical data analysis by DIVA (Data-Interpolating Variational Analysis) tool. GEBCO 1min topography is used for the contouring preparation. Analyzed filed masked using relative error threshold 0.3 and 0.5 DIVA settings. Signal to noise ratio and correlation length were optimized and filtered vertically and a seasonally-averaged profile was used. Logarithmic transformation applied to the data prior to the analysis. Background field: the data mean value is subtracted from the data. Detrending of data: no, Advection consraint applied: no. Units: umol/l
-
Moving 10-years analysis of Silicate at Northeast Atlantic Ocean for each season. - winter: January-March, - spring: April-June, - summer: July-September, - autumn: October-December Every year of the time dimension corresponds to the 10-year centred average of each season. Decades span - from 1963-1972 until 2005-2014 (winter) - from 1979-1988 until 2005-2014 (spring) - from 1990-1999 until 2005-2014 (summer) - from 1964-1973 until 2005-2014 (autumn) Observational data span from 1962 to 2014. Depth range (IODE standard depths): -3000.0, -2500.0, -2000.0, -1750, -1500.0, -1400.0, -1300.0, -1200.0, -1100.0, -1000.0, -900.0, -800.0, -700.0, -600.0, -500.0, -400.0, -300.0, -250.0, -200.0, -150.0, -125.0, -100.0, -75.0, -50.0,-40.0, -30.0, -20.0, -10.0, -5.0, -0.0 Data Sources: observational data from SeaDataNet/EMODNet Chemistry Data Network. Description of DIVA analysis: Geostatistical data analysis by DIVA (Data-Interpolating Variational Analysis) tool. GEBCO 1min topography is used for the contouring preparation. Analyzed filed masked using relative error threshold 0.3 and 0.5 DIVA settings. Signal to noise ratio and correlation length were optimized and filtered vertically and a seasonally-averaged profile was used. Logarithmic transformation applied to the data prior to the analysis. Background field: the data mean value is subtracted from the data. Detrending of data: no, Advection consraint applied: no. Units: umol/l
-

The "EMODnet Digital Bathymetry (DTM) - 2016" is a multilayer bathymetric product for Europe’s sea basins covering:: • the Greater North Sea, including the Kattegat and stretches of water such as Fair Isle, Cromarty, Forth, Forties, Dover, Wight, and Portland • the English Channel and Celtic Seas • Western and Central Mediterranean Sea and Ionian Sea • Bay of Biscay, Iberian coast and North-East Atlantic • Adriatic Sea • Aegean - Levantine Sea (Eastern Mediterranean) • Azores - Madeira EEZ • Canary Islands • Baltic Sea • Black Sea • Norwegian – Icelandic seas The DTM is based upon more than 7700 bathymetric survey data sets and Composite DTMs that have been gathered from 27 data providers from 18 European countries and involving 169 data originators. The gathered survey data sets can be discovered and requested for access through the Common Data Index (CDI) data discovery and access service that also contains additional European survey data sets for global waters. This discovery service makes use of SeaDataNet standards and services and have been integrated in the EMODnet portal (https://emodnet.ec.europa.eu/en/bathymetry#bathymetry-services ). The Composite DTMs are described using the Sextant Catalogue Service that makes also use of SeaDataNet standards and services. Their metadata can retrieved through interrogating the Source Reference map in the Central Map Viewing service (https://emodnet.ec.europa.eu/geoviewer/ ). In addition, the EMODnet Map Viewer gives users wide functionality for viewing and downloading the EMODnet digital bathymetry such as: • water depth (refering to the Lowest Astronomical Tide Datum - LAT) in gridded form on a DTM grid of 1/8 * 1/8 arc minute of longitude and latitude (ca 230 * 230 meters) • option to view depth parameters of individual DTM cells and references to source data • option to download DTM in 16 tiles in different formats: EMO, EMO (without GEBCO data), ESRI ASCII, ESRI ASCII Mean Sea Level, XYZ, NetCDF (CF), RGB GeoTiff and SD • layer with a number of high resolution DTMs for coastal regions • layer with wrecks from the UKHO Wrecks database. The NetCDF (CF) DTM files are fit for use in a special 3D Viewer software package which is based on the existing open source NASA World Wind JSK application. It has been developed in the frame of the EU FP7 Geo-Seas project (another sibling of SeaDataNet for marine geological and geophysical data) and is freely available. The 3D viewer also supports the ingestion of WMS overlay maps. The SD files can also be used for 3D viewing by means of the freely available iView4De(Fledermaus) software. The original datasets themselves are not distributed but described in the metadata services, giving clear information about the background survey data used for the DTM, their access restrictions, originators and distributors and facilitating requests by users to originator.
-
The "EMODnet Digital Bathymetry (DTM) - 2016" is a multilayer bathymetric product for Europe’s sea basins covering:: • the Greater North Sea, including the Kattegat and stretches of water such as Fair Isle, Cromarty, Forth, Forties, Dover, Wight, and Portland • the English Channel and Celtic Seas • Western and Central Mediterranean Sea and Ionian Sea • Bay of Biscay, Iberian coast and North-East Atlantic • Adriatic Sea • Aegean - Levantine Sea (Eastern Mediterranean) • Azores - Madeira EEZ • Canary Islands • Baltic Sea • Black Sea • Norwegian – Icelandic seas The DTM is based upon more than 7700 bathymetric survey data sets and Composite DTMs that have been gathered from 27 data providers from 18 European countries and involving 169 data originators. The gathered survey data sets can be discovered and requested for access through the Common Data Index (CDI) data discovery and access service that also contains additional European survey data sets for global waters. The Composite DTMs can be discovered through the Sextant Catalogue service. Both discovery services make use of SeaDataNet standards and services and have been integrated in the EMODnet portal (https://emodnet.ec.europa.eu/en/bathymetry#bathymetry-services ). In addition, the EMODnet Map Viewer (https://emodnet.ec.europa.eu/geoviewer/ ) gives users wide functionality for viewing and downloading the EMODnet digital bathymetry such as: • water depth (refering to the Lowest Astronomical Tide Datum - LAT) in gridded form on a DTM grid of 1/8 * 1/8 arc minute of longitude and latitude (ca 230 * 230 meters) • option to view depth parameters of individual DTM cells and references to source data • option to download DTM in 16 tiles in different formats: EMO, EMO (without GEBCO data), ESRI ASCII, ESRI ASCII Mean Sea Level, XYZ, NetCDF (CF), RGB GeoTiff and SD • layer with a number of high resolution DTMs for coastal regions • layer with wrecks from the UKHO Wrecks database. The NetCDF (CF) DTM files are fit for use in a special 3D Viewer software package which is based on the existing open source NASA World Wind JSK application. It has been developed in the frame of the EU FP7 Geo-Seas project (another sibling of SeaDataNet for marine geological and geophysical data) and is freely available. The 3D viewer also supports the ingestion of WMS overlay maps. The SD files can also be used for 3D viewing by means of the freely available iView4De(Fledermaus) software. The original datasets themselves are not distributed but described in the metadata services, giving clear information about the background survey data used for the DTM, their access restrictions, originators and distributors and facilitating requests by users to originator.